In the Add Application Insights to an Existing ASP.NET Core Application post from last week, we got Application Insights up and running. This week my plan was to show off some of the features of Application Insights. It turns out this is hard to do in a meaningful way when your application isn’t getting any usage. While I have next to no data for most of the screenshots I still want to point out some of the areas of Application Insights that seem like they would be very useful.
Sample Application
For the most part, the post linked above is a good starting point with the exception of instead of using a React application I switched out for a Razor Pages application. The following is the command to create a Razor Page application with auth using the .NET CLI.
dotnet new webapp --auth Individual
The reason for this change was to get more items in App Insights since Razor Pages makes a request to the server per page.
Application Dashboard
The first item I recommend you check out is the Application Dashboard. On the Azure Portal select your App Insights resource and at the top click Application Dashboard.

This link will drop you on a page that will let you see how your application is doing at a glance. This includes everything from Unique sessions and Failed requests to Average I/O rate and Average available memory.

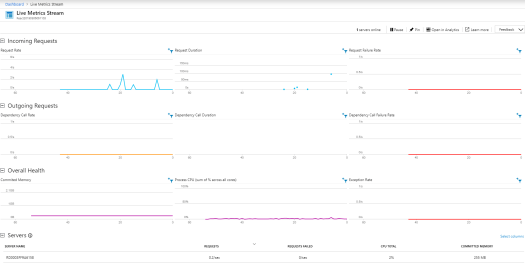
Live Metrics Stream
From your application dashboard or the App Insights menu you if you select Live Metrics Stream you will see real-time information about Incoming Requests, Outgoing Request, Overall Health, and a list of servers your application is running on and some stats about your usage on those servers.
Investigate
As a developer, a lot of the items in the Investigate menu jump out to me as being really helpful.

For example, Failures will give you a graph of failures over your selected timeframe with a list of the failed operations and a summary of the top 3 failed response codes, exception types, and dependency failures. The following screenshot is what it looks like, but my sample application doesn’t have any failures so it may not be super helpful.

The other option I want to point out is Performance which will give you a great summary of how your application is performing with break down by operation. This operation level view is a great place to spot areas in your application that may need some perf work.

Wrapping Up
This post covered a small fraction of the value provided by Application Insights. I encourage you to give the service a try especially if you are running a .NET application and most of the value can be provided without having to make any code changes.
Also published on Medium.